Today’s inventory of residential properties along the Front Range is…
Double what it was in 2021 (the all-time low)
Half of the long-term average (going back to 1985)
One-fifth of what it was in 2006 (the all-time high)

Today’s inventory of residential properties along the Front Range is…
Double what it was in 2021 (the all-time low)
Half of the long-term average (going back to 1985)
One-fifth of what it was in 2006 (the all-time high)

Have you ever wondered how much all of the residential real estate in the U.S. is worth?
It’s $44.5 trillion.
That’s 44 with 12 zeroes after it.
This data comes from the Federal Reserve’s Quarterly “Z.1” report.
The total valuation increased by $2.4 Trillion over the last quarter and is essentially flat compared to one year ago.
In total, liabilities on residential properties (mortgages, equity loans, etc.) is $12.9 trillion.
So, collectively, residential property owners in the U.S. have a 71% equity share and owe 29% of the value.

Here is a look at how the market performed in August 2023 versus August 2022
Prices:
Larimer County Up 4%
Weld County Up 8%
Metro Denver Up 6%
Transactions:
Larimer County Down 18%
Weld County Down 31%
Metro Denver Down 15%
Inventory:
Larimer County Up 18%
Weld County No Change
Metro Denver Down 4%

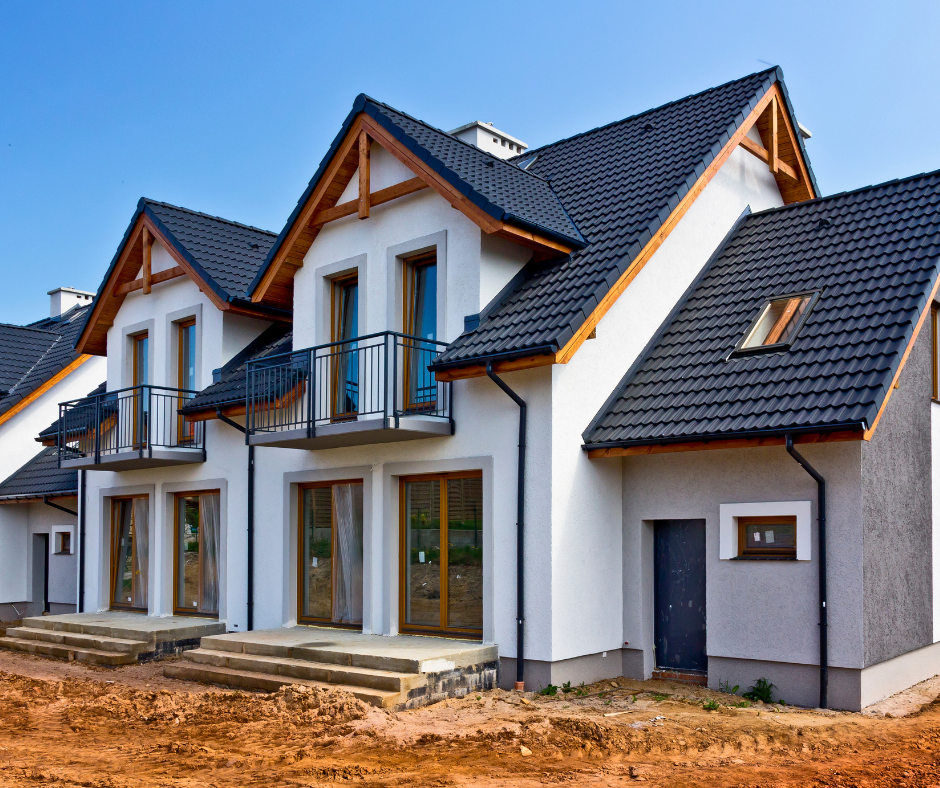
New Homes are where it’s at.
By ‘it,’ we mean inventory.
Given low supply of existing homes, home buyers have figured out that new homes offer an effective place to find homes for sale.
Here are the stats…
Inventory of existing homes is down 7.7% year over year. And, last year’s inventory was historically low.
Meanwhile, sales of new homes rose 4.4%. This increase was much more than most analysts expected.
New Homes are where it is at.

The number of protests filed with Colorado’s 64 county assessors increased 300% in 2023 compared to the average number of protests from the previous three assessment cycles.
Property owners filed at least 308,298 protests with Colorado’s 64 county assessors this year, which compares to an average of 103,000 annual protests in the last three assessment cycles in 2021, 2019 and 2017.
The increase was due to the amount values increased from this valuation period versus the last one. This was because the time frame considered for comparable sales, July 1 2020 to June 30 2022, was arguably the most robust real estate market in our lifetime.

How many showings will a property have before it sells?
In Northern Colorado, the answer is eight.
This is according to our local MLS system called IRES which tracks the median number of showings a property has before going under contract.
This information is valuable to sellers so they can have realistic expectations while starting the process of selling their home.
It is also a useful guideline to gauge if a property is priced correctly. If a home has had more than eight showings but is not under contract yet, there may be an issue with the price and/or condition.
Counterintuitively, this statistic is lower today than it was in the hot market of 2021. Back then the median was 12 in Larimer County and 10 in Weld County.
The reason why it was higher then, even though the market was stronger, is because there were many more buyers looking at properties. Back then there were so many buyers that many homes only allowed 15-minute showing windows in order to accommodate all of the people who wanted to see homes.

To see the resilience of the Front Range market, look no further than Larimer County.
The average price for closed single-family homes in the month of July was $724,000.
This is only the third time in history Larimer County has exceeded $700,000 for average price in a month.
July’s average price is a whopping 12% higher than February’s average price which was $646,000.
A 12% difference in just a few months is significant in any market.
What makes this increase especially significant is that interest rates have been above 6.5% the entire time.
Higher rates did not keep prices from going higher.

The higher-end market in Northern Colorado, in terms of number of closings, is faring better than the overall market.
When we look at the number of homes selling today and the price point of those homes, properties priced above $1,000,000 are performing better than the market as a whole.
The number of closings occurring now compared to this same time last year is down 30% overall. But, the high-end market is only down 19%.
When we look further back in time, the data gets even more interesting.
Compared to 2021, Closings today are down 55% overall, but high-end sales are up 26%.
And compared to 2020, there are 59% fewer closings and 160% more high-end sales.
We believe there are two reasons for this dynamic.
First, because of price increases over the last few years, the stock of inventory today includes more $1,000,000- plus homes than the past.
Second, the high-end buyer is less affected by higher interest rates than the general population. And, certainly less affected than first-time buyers.

Here is an interesting look at the market year to date versus the same time period in 2022.
Bottom line, the number of transactions is down considerably, and prices are flat to slightly down.
Larimer County = Sales down 17.5%, prices up 0.7%
Weld County = Sales down 29.6%, prices down 2.2%
Metro Denver = Sales down 22.4%, prices down 2.9%

One of the many opportunities for buyers today is new construction.
In Northern Colorado, just under 25% of all available homes for sale are brand new homes.
That percentage is roughly 50% more than normal.
Buyers who are looking for a greater selection can consider new homes.
New homes offer obvious advantages like trendy finishes and new appliances.
They also often offer attractive incentives like lower mortgage rates.
So, in a time when it feels like there is less to choose from, new homes are a great option.